Area chart
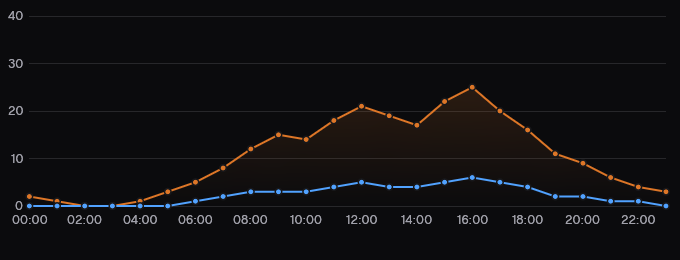
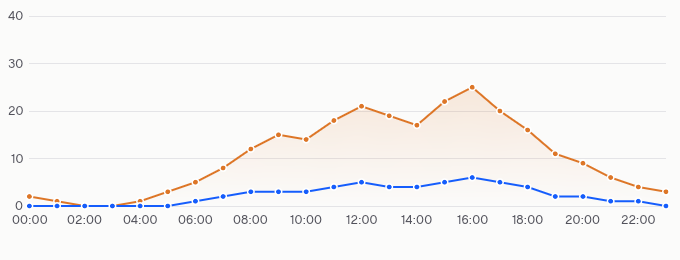
An area chart shows how one or more series move across the same x labels, the first series filled under its 2 px line and any others drawn as lines over it. The lines draw in, and points are ringed while a series has 31 or fewer. Each series takes one of the theme's five chart hues; a legend appears for two series or more, and a chart with no values says No data yet.
One series
One series over time; the fill shows the volume.
ChartModel {
    kind: ChartKind::Area,
    series: vec![
        Series {
            name: "Tickets".into(),
            values: vec![42.0, 51.0, 47.0, 63.0, 58.0, 31.0, 27.0],
            hue: 1,
        },
    ],
    x_ticks: days(),
    title: Some("Tickets per day".into()),
}Two series
Areas overlap; the legend names each.
ChartModel {
    kind: ChartKind::Area,
    series: vec![
        Series {
            name: "Agents".into(),
            values: vec![30.0, 34.0, 33.0, 41.0, 44.0, 22.0, 20.0],
            hue: 1,
        },
        Series {
            name: "People".into(),
            values: vec![12.0, 17.0, 14.0, 22.0, 14.0, 9.0, 7.0],
            hue: 2,
        },
    ],
    x_ticks: days(),
    title: Some("Resolved by".into()),
}No data
A chart without values says so in one sentence.
No data yet
ChartModel {
    kind: ChartKind::Area,
    series: Vec::new(),
    x_ticks: Vec::new(),
    title: Some("Tickets per day".into()),
}On the Mac
The same vocabulary drawn by Ocean UI's native face (egui on Metal), as the gallery's snapshot.
Use it
Web
use ocean_ui_core::chart::{ChartKind, ChartModel, Series};
let lands = Series { name: "Lands".into(), values: vec![3.0, 5.0, 4.0], hue: 1 };
ChartModel { kind: ChartKind::Area, series: vec![lands], x_ticks: vec!["Mon".into(), "Tue".into(), "Wed".into()], title: Some("Lands this week".into()) }Native
use ocean_ui_native::{Show, charts::AreaChart, egui::Id};
AreaChart { model: &model, range_label: Some("24 h"), id: Id::unique(("gallery.chart", false)), height: 220.0 }.show(ui)Cargo feature charts of ocean-ui-core, ocean-ui-web and ocean-ui-native; available since 2026-10-29.
In App UI, the chart block draws it from YAML.
Props
| Name | Type | Default | What |
|---|---|---|---|
kind | ChartKind | — | Area: the first series filled, the rest drawn as lines. |
series | Vec<Series> | — | The runs of values, each a Series { name, values: Vec<f64>, hue: u8 } whose hue 1 to 5 picks a chart colour. |
x_ticks | Vec<String> | — | The x labels, one per value; a missing one shows its position, counted from 1. |
title | Option<String> | None | The chart's accessible name, Chart when absent. |
Accessibility
- The SVG is role="img" with the title as its aria-label, or Chart when there is none, so give every chart a title.
- Each x position carries a title with its label and every series' value, shown on hover over its band.
- The axis labels are aria-hidden, the legend is the figure's figcaption, and the draw-in does not run under reduced motion.
Related
Markdown
The same page as Markdown, for an agent or a pull request.
# Area chart
A chart of values over x labels, the first series filled under its line, with axes, tooltips and a legend.
An area chart shows how one or more series move across the same x labels, the first series filled under its 2 px line and any others drawn as lines over it. The lines draw in, and points are ringed while a series has 31 or fewer. Each series takes one of the theme's five chart hues; a legend appears for two series or more, and a chart with no values says No data yet.
## Use it
Web:
```rust
use ocean_ui_core::chart::{ChartKind, ChartModel, Series};
let lands = Series { name: "Lands".into(), values: vec![3.0, 5.0, 4.0], hue: 1 };
ChartModel { kind: ChartKind::Area, series: vec![lands], x_ticks: vec!["Mon".into(), "Tue".into(), "Wed".into()], title: Some("Lands this week".into()) }
```
Native:
```rust
use ocean_ui_native::{Show, charts::AreaChart, egui::Id};
AreaChart { model: &model, range_label: Some("24 h"), id: Id::unique(("gallery.chart", false)), height: 220.0 }.show(ui)
```
Cargo feature `charts`; since 2026-10-29.
In App UI the `chart` block draws it ([chart](/ui/blocks/chart.md)).
## Props
| Name | Type | Default | What |
|---|---|---|---|
| `kind` | `ChartKind` | `—` | Area: the first series filled, the rest drawn as lines. |
| `series` | `Vec<Series>` | `—` | The runs of values, each a Series { name, values: Vec<f64>, hue: u8 } whose hue 1 to 5 picks a chart colour. |
| `x_ticks` | `Vec<String>` | `—` | The x labels, one per value; a missing one shows its position, counted from 1. |
| `title` | `Option<String>` | `None` | The chart's accessible name, Chart when absent. |
On the Mac:  
## Examples
### One series
One series over time; the fill shows the volume.
```rust
ChartModel {
kind: ChartKind::Area,
series: vec![
Series {
name: "Tickets".into(),
values: vec![42.0, 51.0, 47.0, 63.0, 58.0, 31.0, 27.0],
hue: 1,
},
],
x_ticks: days(),
title: Some("Tickets per day".into()),
}
```
### Two series
Areas overlap; the legend names each.
```rust
ChartModel {
kind: ChartKind::Area,
series: vec![
Series {
name: "Agents".into(),
values: vec![30.0, 34.0, 33.0, 41.0, 44.0, 22.0, 20.0],
hue: 1,
},
Series {
name: "People".into(),
values: vec![12.0, 17.0, 14.0, 22.0, 14.0, 9.0, 7.0],
hue: 2,
},
],
x_ticks: days(),
title: Some("Resolved by".into()),
}
```
### No data
A chart without values says so in one sentence.
```rust
ChartModel {
kind: ChartKind::Area,
series: Vec::new(),
x_ticks: Vec::new(),
title: Some("Tickets per day".into()),
}
```
## Accessibility
- The SVG is role="img" with the title as its aria-label, or Chart when there is none, so give every chart a title.
- Each x position carries a title with its label and every series' value, shown on hover over its band.
- The axis labels are aria-hidden, the legend is the figure's figcaption, and the draw-in does not run under reduced motion.
## Related
- [Line chart](/ui/components/line.md)
- [Bar chart](/ui/components/bar.md)
- [Spark](/ui/components/spark.md)