Donut
A donut is a ChartModel of kind Donut: the first series' values are its segments and x_ticks names them. Values of zero or less are left out, the total sits in the centre over the series' name, and the legend lists every part with its value. Use it for a few parts of one whole; for change over time use a line or area chart.
Share of a whole
Parts of one total, each named in the legend.
ChartModel {
    kind: ChartKind::Donut,
    series: vec![
        Series { name: "Channels".into(), values: vec![58.0, 27.0, 15.0], hue: 1 },
    ],
    x_ticks: ["Email", "Chat", "Phone"].map(String::from).to_vec(),
    title: Some("Tickets by channel".into()),
}Two parts
A pair reads as done and left.
ChartModel {
    kind: ChartKind::Donut,
    series: vec![
        Series { name: "Budget".into(), values: vec![6420.0, 3580.0], hue: 1 },
    ],
    x_ticks: ["Spent", "Left"].map(String::from).to_vec(),
    title: Some("Monthly budget".into()),
}Five parts
Keep to five; the theme has five chart colours.
ChartModel {
    kind: ChartKind::Donut,
    series: vec![
        Series {
            name: "Models".into(),
            values: vec![40.0, 25.0, 15.0, 12.0, 8.0],
            hue: 1,
        },
    ],
    x_ticks: ["Claude", "GPT", "Gemini", "Llama", "Other"].map(String::from).to_vec(),
    title: Some("Calls by model".into()),
}On the Mac
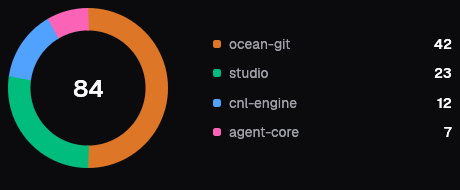
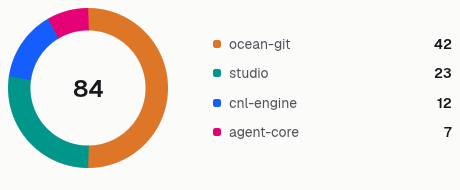
The same vocabulary drawn by Ocean UI's native face (egui on Metal), as the gallery's snapshot.
Use it
Web
use ocean_ui_core::chart::{ChartKind, ChartModel, Series};
let tickets = Series { name: "Tickets".into(), values: vec![12.0, 5.0, 3.0], hue: 1 };
ChartModel { kind: ChartKind::Donut, series: vec![tickets], x_ticks: vec!["Open".into(), "Pending".into(), "Closed".into()], title: Some("Tickets by state".into()) }Native
use ocean_ui_native::{Show, charts::Donut, egui::Id};
let parts: Vec<(String, f64, u8)> = [("ocean-git", 42.0, 1), ("studio", 23.0, 2), ("cnl-engine", 12.0, 3), ("agent-core", 7.0, 5)].map(|(n, v, h)| (n.to_string(), v, h)).to_vec();
Donut { total: "84", parts: &parts, id: Id::unique("gallery.donut"), size: 160.0 }.show(ui)Cargo feature charts of ocean-ui-core, ocean-ui-web and ocean-ui-native; available since 2026-10-29.
In App UI, the chart block draws it from YAML.
Props
| Name | Type | Default | What |
|---|---|---|---|
kind | ChartKind | — | Donut. |
series | Vec<Series> | — | One Series { name, values, hue } whose values are the parts and whose name sits under the total; the parts take the five chart hues in turn. |
x_ticks | Vec<String> | — | The parts' names, in the order of the values. |
title | Option<String> | None | The ring's accessible name, Chart when absent. |
Accessibility
- The ring's SVG is role="img" with the title as its aria-label.
- Each segment carries a title with its name and value, and the legend repeats both as text.
- The total in the centre is aria-hidden; the legend's values carry the figures.
Related
Markdown
The same page as Markdown, for an agent or a pull request.
# Donut
A ring that shows how one series splits into parts, with its total in the middle and a legend.
A donut is a ChartModel of kind Donut: the first series' values are its segments and x_ticks names them. Values of zero or less are left out, the total sits in the centre over the series' name, and the legend lists every part with its value. Use it for a few parts of one whole; for change over time use a line or area chart.
## Use it
Web:
```rust
use ocean_ui_core::chart::{ChartKind, ChartModel, Series};
let tickets = Series { name: "Tickets".into(), values: vec![12.0, 5.0, 3.0], hue: 1 };
ChartModel { kind: ChartKind::Donut, series: vec![tickets], x_ticks: vec!["Open".into(), "Pending".into(), "Closed".into()], title: Some("Tickets by state".into()) }
```
Native:
```rust
use ocean_ui_native::{Show, charts::Donut, egui::Id};
let parts: Vec<(String, f64, u8)> = [("ocean-git", 42.0, 1), ("studio", 23.0, 2), ("cnl-engine", 12.0, 3), ("agent-core", 7.0, 5)].map(|(n, v, h)| (n.to_string(), v, h)).to_vec();
Donut { total: "84", parts: &parts, id: Id::unique("gallery.donut"), size: 160.0 }.show(ui)
```
Cargo feature `charts`; since 2026-10-29.
In App UI the `chart` block draws it ([chart](/ui/blocks/chart.md)).
## Props
| Name | Type | Default | What |
|---|---|---|---|
| `kind` | `ChartKind` | `—` | Donut. |
| `series` | `Vec<Series>` | `—` | One Series { name, values, hue } whose values are the parts and whose name sits under the total; the parts take the five chart hues in turn. |
| `x_ticks` | `Vec<String>` | `—` | The parts' names, in the order of the values. |
| `title` | `Option<String>` | `None` | The ring's accessible name, Chart when absent. |
On the Mac:  
## Examples
### Share of a whole
Parts of one total, each named in the legend.
```rust
ChartModel {
kind: ChartKind::Donut,
series: vec![
Series { name: "Channels".into(), values: vec![58.0, 27.0, 15.0], hue: 1 },
],
x_ticks: ["Email", "Chat", "Phone"].map(String::from).to_vec(),
title: Some("Tickets by channel".into()),
}
```
### Two parts
A pair reads as done and left.
```rust
ChartModel {
kind: ChartKind::Donut,
series: vec![
Series { name: "Budget".into(), values: vec![6420.0, 3580.0], hue: 1 },
],
x_ticks: ["Spent", "Left"].map(String::from).to_vec(),
title: Some("Monthly budget".into()),
}
```
### Five parts
Keep to five; the theme has five chart colours.
```rust
ChartModel {
kind: ChartKind::Donut,
series: vec![
Series {
name: "Models".into(),
values: vec![40.0, 25.0, 15.0, 12.0, 8.0],
hue: 1,
},
],
x_ticks: ["Claude", "GPT", "Gemini", "Llama", "Other"].map(String::from).to_vec(),
title: Some("Calls by model".into()),
}
```
## Accessibility
- The ring's SVG is role="img" with the title as its aria-label.
- Each segment carries a title with its name and value, and the legend repeats both as text.
- The total in the centre is aria-hidden; the legend's values carry the figures.
## Related
- [Bar chart](/ui/components/bar.md)
- [Spark](/ui/components/spark.md)
- [KPI](/ui/components/kpi.md)