KPI
A KPI tile answers one question with one number. The figure is a count, grouped as 12,480 and counted up as it appears, or ready text such as 98.2% or 1.4 s. When the figure is compacted, exact holds the full value as a tooltip; a delta or a badge sits beside the label, and a spark draws the recent trend under the figure.
With a comparison
A number with what it is measured against, and a spark of the trend.
Open tickets
−361,284
Against last week
Kpi {
    label: "Open tickets".into(),
    figure: Figure::Count(1_284),
    delta: Some(Delta { by: -36, against: 1_320, fewer_is_better: true }),
    caption: Some("Against last week".into()),
    spark: Some(vec![9.0, 11.0, 10.0, 13.0, 12.0, 15.0, 14.0]),
    ..Default::default()
}A row of tiles
Tiles say how it is going; at most eight on a screen.
Resolved today
+41342
First reply
4 min
Median, last 24 hours
Spend this month
On budget$8,420
out.push_str(r#"<div class="u-kpis">"#);
Kpi {
    label: "Resolved today".into(),
    figure: Figure::Count(342),
    delta: Some(Delta { by: 41, against: 301, fewer_is_better: false }),
    ..Default::default()
}.html(out);
Kpi {
    label: "First reply".into(),
    figure: Figure::Text("4 min".into()),
    caption: Some("Median, last 24 hours".into()),
    ..Default::default()
}.html(out);
Kpi {
    label: "Spend this month".into(),
    figure: Figure::Text("$8,420".into()),
    badge: Some(Badge { text: "On budget".into(), tone: Tone::Ok }),
    ..Default::default()
}.html(out);
out.push_str("</div>");Compact figure
A large count is shortened; the exact value is its tooltip.
Rows synced
2.4M
Since the first sync
Kpi {
    label: "Rows synced".into(),
    figure: Figure::Text("2.4M".into()),
    exact: Some("2,418,903".into()),
    caption: Some("Since the first sync".into()),
    ..Default::default()
}On the Mac
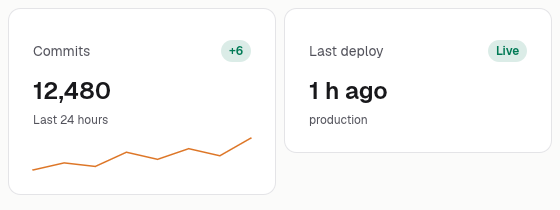
The same vocabulary drawn by Ocean UI's native face (egui on Metal), as the gallery's snapshot.

Use it
Web
use ocean_ui_core::{Delta, Figure, Kpi};
let delta = Some(Delta { by: -6, against: 134, fewer_is_better: true });
Kpi { label: "Open tickets".into(), figure: Figure::Count(128), delta, ..Default::default() }Native
use ocean_ui_native::{Show, core::{Delta, Figure, Kpi}};
let delta = Some(Delta { by: 6, against: 24, fewer_is_better: false });
Kpi { label: "Commits".into(), figure: Figure::Count(12_480), delta, ..Default::default() }.show(ui);Cargo feature tiles of ocean-ui-core, ocean-ui-web and ocean-ui-native; available since 2026-10-29.
In App UI, the kpis block draws it from YAML.
Props
| Name | Type | Default | What |
|---|---|---|---|
label | String | — | What the figure counts, in sentence case. |
figure | Figure | Count(0) | Figure::Count(n), a whole number grouped and counted up, or Figure::Text(s), ready words. |
exact | Option<String> | None | The full value as a tooltip when the figure is compacted. |
delta | Option<Delta> | None | The change since the last period, beside the label. |
badge | Option<Badge> | None | A short state beside the label. |
caption | Option<String> | None | One line under the figure, such as the period it covers. |
spark | Option<Vec<f32>> | None | Recent values drawn as a small line under the figure. |
Accessibility
- The tile is a section with its label as an h3, so it shows in the page's heading outline.
- A count is written into the page as grouped text, so a screen reader reads the final number; the count-up does not run under reduced motion.
- The spark is aria-hidden and the exact value is only a title tooltip, so put anything that matters in the caption or the delta.
Related
Markdown
The same page as Markdown, for an agent or a pull request.
# KPI
A tile with a label and one headline figure, and when they help a delta, a badge, a caption and a spark.
A KPI tile answers one question with one number. The figure is a count, grouped as 12,480 and counted up as it appears, or ready text such as 98.2% or 1.4 s. When the figure is compacted, exact holds the full value as a tooltip; a delta or a badge sits beside the label, and a spark draws the recent trend under the figure.
## Use it
Web:
```rust
use ocean_ui_core::{Delta, Figure, Kpi};
let delta = Some(Delta { by: -6, against: 134, fewer_is_better: true });
Kpi { label: "Open tickets".into(), figure: Figure::Count(128), delta, ..Default::default() }
```
Native:
```rust
use ocean_ui_native::{Show, core::{Delta, Figure, Kpi}};
let delta = Some(Delta { by: 6, against: 24, fewer_is_better: false });
Kpi { label: "Commits".into(), figure: Figure::Count(12_480), delta, ..Default::default() }.show(ui);
```
Cargo feature `tiles`; since 2026-10-29.
In App UI the `kpis` block draws it ([kpis](/ui/blocks/kpis.md)).
## Props
| Name | Type | Default | What |
|---|---|---|---|
| `label` | `String` | `—` | What the figure counts, in sentence case. |
| `figure` | `Figure` | `Count(0)` | Figure::Count(n), a whole number grouped and counted up, or Figure::Text(s), ready words. |
| `exact` | `Option<String>` | `None` | The full value as a tooltip when the figure is compacted. |
| `delta` | `Option<Delta>` | `None` | The change since the last period, beside the label. |
| `badge` | `Option<Badge>` | `None` | A short state beside the label. |
| `caption` | `Option<String>` | `None` | One line under the figure, such as the period it covers. |
| `spark` | `Option<Vec<f32>>` | `None` | Recent values drawn as a small line under the figure. |
On the Mac:  
## Examples
### With a comparison
A number with what it is measured against, and a spark of the trend.
```rust
Kpi {
label: "Open tickets".into(),
figure: Figure::Count(1_284),
delta: Some(Delta { by: -36, against: 1_320, fewer_is_better: true }),
caption: Some("Against last week".into()),
spark: Some(vec![9.0, 11.0, 10.0, 13.0, 12.0, 15.0, 14.0]),
..Default::default()
}
```
### A row of tiles
Tiles say how it is going; at most eight on a screen.
```rust
out.push_str(r#"<div class="u-kpis">"#);
Kpi {
label: "Resolved today".into(),
figure: Figure::Count(342),
delta: Some(Delta { by: 41, against: 301, fewer_is_better: false }),
..Default::default()
}.html(out);
Kpi {
label: "First reply".into(),
figure: Figure::Text("4 min".into()),
caption: Some("Median, last 24 hours".into()),
..Default::default()
}.html(out);
Kpi {
label: "Spend this month".into(),
figure: Figure::Text("$8,420".into()),
badge: Some(Badge { text: "On budget".into(), tone: Tone::Ok }),
..Default::default()
}.html(out);
out.push_str("</div>");
```
### Compact figure
A large count is shortened; the exact value is its tooltip.
```rust
Kpi {
label: "Rows synced".into(),
figure: Figure::Text("2.4M".into()),
exact: Some("2,418,903".into()),
caption: Some("Since the first sync".into()),
..Default::default()
}
```
## Accessibility
- The tile is a section with its label as an h3, so it shows in the page's heading outline.
- A count is written into the page as grouped text, so a screen reader reads the final number; the count-up does not run under reduced motion.
- The spark is aria-hidden and the exact value is only a title tooltip, so put anything that matters in the caption or the delta.
## Related
- [Delta](/ui/components/delta.md)
- [Spark](/ui/components/spark.md)
- [Card](/ui/components/card.md)