Spark
A spark is a ChartModel of kind Spark: only the first series is drawn, stretched to its box in that series' hue. It shows the shape of a trend, not its values, so set it beside a figure. A KPI tile draws the same spark from its spark field.
Trend
A small line without axes, for a trend at a glance.
ChartModel {
    kind: ChartKind::Spark,
    series: vec![
        Series {
            name: "Signups".into(),
            values: vec![3.0, 5.0, 4.0, 8.0, 7.0, 11.0, 13.0],
            hue: 1,
        },
    ],
    x_ticks: Vec::new(),
    title: None,
}Falling
The same drawing for a fall; the tile's delta says if it is good.
ChartModel {
    kind: ChartKind::Spark,
    series: vec![
        Series {
            name: "Errors".into(),
            values: vec![14.0, 12.0, 13.0, 9.0, 7.0, 6.0, 4.0],
            hue: 2,
        },
    ],
    x_ticks: Vec::new(),
    title: None,
}Another hue
Hues one to five pick the theme's chart colours.
ChartModel {
    kind: ChartKind::Spark,
    series: vec![
        Series {
            name: "Spend".into(),
            values: vec![5.0, 5.0, 6.0, 5.0, 7.0, 6.0, 8.0],
            hue: 4,
        },
    ],
    x_ticks: Vec::new(),
    title: None,
}On the Mac
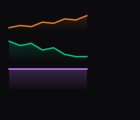
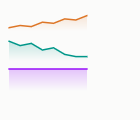
The same vocabulary drawn by Ocean UI's native face (egui on Metal), as the gallery's snapshot.
Use it
Web
use ocean_ui_core::chart::{ChartKind, ChartModel, Series};
let visits = Series { name: "Visits".into(), values: vec![4.0, 6.0, 5.0, 8.0], hue: 2 };
ChartModel { kind: ChartKind::Spark, series: vec![visits], x_ticks: vec![], title: None }Native
use ocean_ui_native::{Show, charts::Spark};
Spark { values: &[3.0, 5.0, 4.0, 8.0, 7.0, 11.0, 10.0, 14.0], hue: 1 }.show(ui)Cargo feature charts of ocean-ui-core, ocean-ui-web and ocean-ui-native; available since 2026-10-29.
In App UI, the kpis block draws it from YAML.
Props
| Name | Type | Default | What |
|---|---|---|---|
kind | ChartKind | — | Spark. |
series | Vec<Series> | — | One Series { name, values, hue } whose values make the line and whose hue 1 to 5 colours it. |
x_ticks | Vec<String> | — | Not drawn; a spark has no axes. |
title | Option<String> | None | Not written; a spark is decorative. |
Accessibility
- The SVG is aria-hidden and not focusable, so the spark adds nothing to the accessibility tree.
- Put the figure it illustrates in text beside it, as a KPI tile does with its label and figure.
Related
Markdown
The same page as Markdown, for an agent or a pull request.
# Spark
A small line with its area and no axes, a trend at a glance, also drawn inside a KPI tile.
A spark is a ChartModel of kind Spark: only the first series is drawn, stretched to its box in that series' hue. It shows the shape of a trend, not its values, so set it beside a figure. A KPI tile draws the same spark from its spark field.
## Use it
Web:
```rust
use ocean_ui_core::chart::{ChartKind, ChartModel, Series};
let visits = Series { name: "Visits".into(), values: vec![4.0, 6.0, 5.0, 8.0], hue: 2 };
ChartModel { kind: ChartKind::Spark, series: vec![visits], x_ticks: vec![], title: None }
```
Native:
```rust
use ocean_ui_native::{Show, charts::Spark};
Spark { values: &[3.0, 5.0, 4.0, 8.0, 7.0, 11.0, 10.0, 14.0], hue: 1 }.show(ui)
```
Cargo feature `charts`; since 2026-10-29.
In App UI the `kpis` block draws it ([kpis](/ui/blocks/kpis.md)).
## Props
| Name | Type | Default | What |
|---|---|---|---|
| `kind` | `ChartKind` | `—` | Spark. |
| `series` | `Vec<Series>` | `—` | One Series { name, values, hue } whose values make the line and whose hue 1 to 5 colours it. |
| `x_ticks` | `Vec<String>` | `—` | Not drawn; a spark has no axes. |
| `title` | `Option<String>` | `None` | Not written; a spark is decorative. |
On the Mac:  
## Examples
### Trend
A small line without axes, for a trend at a glance.
```rust
ChartModel {
kind: ChartKind::Spark,
series: vec![
Series {
name: "Signups".into(),
values: vec![3.0, 5.0, 4.0, 8.0, 7.0, 11.0, 13.0],
hue: 1,
},
],
x_ticks: Vec::new(),
title: None,
}
```
### Falling
The same drawing for a fall; the tile's delta says if it is good.
```rust
ChartModel {
kind: ChartKind::Spark,
series: vec![
Series {
name: "Errors".into(),
values: vec![14.0, 12.0, 13.0, 9.0, 7.0, 6.0, 4.0],
hue: 2,
},
],
x_ticks: Vec::new(),
title: None,
}
```
### Another hue
Hues one to five pick the theme's chart colours.
```rust
ChartModel {
kind: ChartKind::Spark,
series: vec![
Series {
name: "Spend".into(),
values: vec![5.0, 5.0, 6.0, 5.0, 7.0, 6.0, 8.0],
hue: 4,
},
],
x_ticks: Vec::new(),
title: None,
}
```
## Accessibility
- The SVG is aria-hidden and not focusable, so the spark adds nothing to the accessibility tree.
- Put the figure it illustrates in text beside it, as a KPI tile does with its label and figure.
## Related
- [KPI](/ui/components/kpi.md)
- [Area chart](/ui/components/area.md)
- [Delta](/ui/components/delta.md)